
US Population Twin
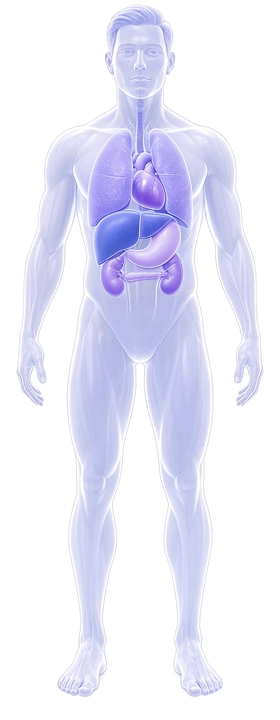










Counted from sex, age, BMI and smoking. The other values change the risks only.
Loading CDC NHANES data…
Risks that need lab values you did not enter use the NHANES median for this profile.
Educational simulation based on CDC NHANES 2015–2018. Not medical advice.
Planning a clinical trial?Create your report How it's calculated
Method
Every number comes from a published, peer-reviewed formula or guideline cut-off, or from CDC survey data. Nothing is generated by AI. Open a row for the formula and its source.
We use the American Heart Association PREVENT equations, base model, 10-year horizon: separate equations for women and men for ASCVD (heart attack or stroke), heart failure and total cardiovascular disease. Inputs: age, total and HDL cholesterol, systolic blood pressure, blood-pressure medicine, statin, diabetes (HbA1c 6.5% or more), current smoking, eGFR (from creatinine) and, for heart failure, BMI. Risk = 1 / (1 + e−x), where x is the published sum of coefficients times centred inputs.
The coefficients are copied exactly from the paper's supplement (cross-checked against the open-source preventr package and an independently published copy of the table). Our code reproduces the published worked example exactly: a 50-year-old woman, SBP 160 on treatment, TC 200, HDL 45, diabetes, non-smoker, eGFR 90, BMI 35 → total CVD 14.7%, ASCVD 9.2%, heart failure 8.1%.
Categories for ASCVD (2026 ACC/AHA dyslipidemia guideline): low under 3%, borderline 3–5%, intermediate 5–10%, high 10% or more. Heart failure has no official categories, so we show the percentage without a category word or colour. PREVENT is defined only for ages 30–79; other inputs outside the validated ranges (TC 130–320, HDL 20–100, SBP 90–200, BMI 18.5–39.9, eGFR 15–140) are capped at the nearest limit.
Sources: Khan SS et al. Circulation 2024;149:430–449, doi:10.1161/CIRCULATIONAHA.123.067626 · 2026 ACC/AHA multisociety dyslipidemia guideline, doi:10.1161/CIR.0000000000001423 · preventr (R package)
Blood sugar status uses the American Diabetes Association diagnostic cut-offs: HbA1c under 5.7% normal, 5.7–6.4% prediabetes, 6.5% or more diabetes range; fasting glucose 100–125 mg/dL prediabetes, 126 or more diabetes range (only used if you enter it).
If your blood sugar is normal, we show the ADA Diabetes Risk Test (Bang et al. 2009): age (40–49: 1, 50–59: 2, 60+: 3), male sex (1), gestational diabetes (1), parent or sibling with diabetes (1), high blood pressure (1), not physically active (1), BMI 25–29.9 (1), 30–39.9 (2), 40+ (3). 5 or more = increased risk. We count high blood pressure as taking blood-pressure medicine or 140/90 or more.
Sources: ADA Standards of Care 2025, Diagnosis and Classification, doi:10.2337/dc25-S002 · Bang H et al. Ann Intern Med 2009;151:775–783, doi:10.7326/0003-4819-151-11-200912010-00005 · CDC: how the test is scored
eGFR is calculated from creatinine with the race-free CKD-EPI 2021 equation: 142 × min(Scr/κ, 1)α × max(Scr/κ, 1)−1.200 × 0.9938age × 1.012 (women); κ = 0.7 (women) / 0.9 (men), α = −0.241 / −0.302.
Stages follow KDIGO: G1 ≥90, G2 60–89, G3a 45–59, G3b 30–44, G4 15–29, G5 under 15; albuminuria A1 under 30, A2 30–300, A3 over 300 mg/g. The colour follows the KDIGO risk heat map. Chronic kidney disease means eGFR under 60 or albuminuria for more than 3 months, so G1–G2 with A1 is not CKD.
Sources: Inker LA et al. N Engl J Med 2021;385:1737–1749, doi:10.1056/NEJMoa2102953 · KDIGO 2024 CKD guideline, Kidney Int 2024;105(4S):S117–S314, doi:10.1016/j.kint.2023.10.018
FLI = eL / (1 + eL) × 100, with L = 0.953 × ln(triglycerides) + 0.139 × BMI + 0.718 × ln(GGT) + 0.053 × waist − 15.745. Under 30 rules fatty liver out (shown as “unlikely”), 60 or more rules it in (“likely”); 30–59 is “indeterminate”. The index was built in Italian adults and is widely validated, but it is a screening score, not a diagnosis.
Source: Bedogni G et al. BMC Gastroenterol 2006;6:33, doi:10.1186/1471-230X-6-33
Normal under 120/80; elevated 120–129 and under 80; stage 1 130–139 or 80–89; stage 2 140+ or 90+. Above 180/120 we show “crisis range”, the guideline’s threshold for a hypertensive crisis. A diagnosis needs an average of readings on two or more occasions.
Source: Whelton PK et al. Hypertension 2018;71:e13–e115, doi:10.1161/HYP.0000000000000065
3 or more of 5: waist 88 cm+ (women) or 102 cm+ (men, US cut-offs); triglycerides 150+; HDL under 50 (women) or 40 (men); blood pressure 130/85+ or on medicine; fasting glucose 100+ or on diabetes treatment (we count HbA1c 6.5%+ as diabetes).
Source: Alberti KGMM et al. Circulation 2009;120:1640–1645, doi:10.1161/CIRCULATIONAHA.109.192644
Total cholesterol under 200 mg/dL desirable, 200–239 borderline high, 240+ high. HDL under 40 low, 60+ high. (The metabolic syndrome criteria use a different HDL cut-off for women, under 50.)
Source: NCEP Adult Treatment Panel III, JAMA 2001;285:2486–2497, doi:10.1001/jama.285.19.2486
Non-pregnant adults: anemia if hemoglobin is under 12.0 g/dL (women) or 13.0 g/dL (men). Mild down to 11.0, moderate 8.0–10.9, severe under 8.0. (Cut-offs differ in pregnancy and are adjusted for altitude and smoking in the full guideline; we don't apply those adjustments.)
Source: WHO guideline on haemoglobin cutoffs to define anaemia, 2024, who.int
BMI under 18.5 underweight, 18.5–24.9 healthy weight, 25–29.9 overweight, 30–34.9 class 1, 35–39.9 class 2, 40+ class 3 obesity.
Source: CDC adult BMI categories
We use NHANES 2015–2018 (CDC): 11,268 adults who were interviewed, examined and tested, standing for 243.8 million US adults through their survey weights (exam weights, divided by 2 for two cycles). The profile means the same sex, age within 5 years, BMI within 2.5 and the same smoking status (marked with a small dot next to those inputs). Blood pressure, blood sugar and cholesterol change your risks, not this count: matching on them as well would leave too few real participants to count, and we don’t model or invent people who aren’t in the data.
The number is the sum of the weights of those people. The 95% range uses the survey design (strata and clusters, Taylor linearisation), the same method as Trial Fit. If fewer than 30 people match, the window widens (age ±8, BMI ±4, then age ±10, BMI ±5 without smoking) and the page says so. If there are still fewer than 30, we show “Not enough data” instead of a number.
“X% of US adults with this profile” is the weighted share of that group with the condition, measured in NHANES: heart disease or stroke and heart failure (told by a doctor), diabetes (lab test, diagnosis or medicine), kidney markers (eGFR under 60 or albumin 30+), Fatty Liver Index 60+, blood pressure 130/80+ or medicine, metabolic syndrome, cholesterol 240+, anemia (WHO). Triglycerides and fasting glucose were only measured in the morning fasting subsample (about 45% of people), so those shares and typical values use that subsample with its own NCHS fasting weight. When fewer than 30 people have the data, we show “Not enough data” instead of a share.
Data: CDC NHANES. Public-use files, no names or IDs; everything is computed in your browser and nothing you enter leaves it.
Waist, triglycerides, GGT, fasting glucose, hemoglobin, creatinine and urine albumin are optional. Until you set them, we use the typical value (weighted median) for US adults with this profile (falling back to the same sex and age ±10, then the same sex, if fewer than 15 have it measured), and rows that depend on them say “typical values”. Nothing is ever filled in with a made-up number. Fasting glucose is never used for the diabetes status unless you enter it.
- This is an educational simulation, not a diagnosis and not medical advice. Talk to a doctor about your results.
- The data are from 2015–2018; today's population is slightly older and heavier.
- Risk equations describe groups of people; they can't tell what will happen to one person. PREVENT doesn't include family history, ethnicity, or other risk enhancers.
- Diagnoses in NHANES are self-reported (“ever told by a doctor”). Fasting measurements come from a subsample.
- One reading of blood pressure, sugar or kidney function is not enough for a diagnosis.
Every formula has unit tests against published examples or independent implementations (13 tests): the PREVENT worked example (14.7% / 9.2% / 8.1%), PREVENT coefficients against a second published copy of the table, CKD-EPI 2021 against Trial Fit's own implementation and hand calculation, and every category boundary for KDIGO, ACC/AHA, CDC, ADA, harmonized metabolic syndrome, FLI, WHO and NCEP.
Create your report
Upload your protocol or enter an NCT ID.